What is a Fishbone Diagram and what is it used for?
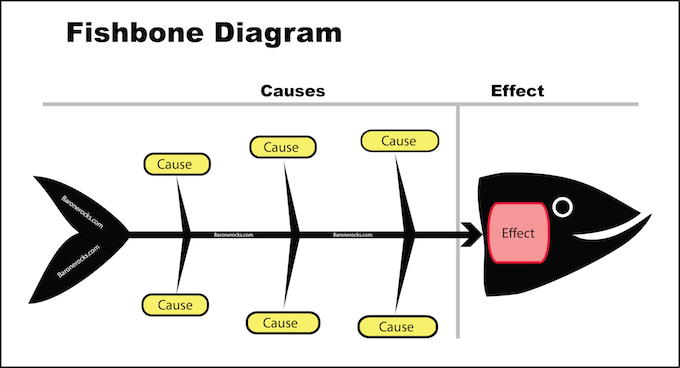
Fishbone Diagram for Root Cause Analysis
Also known as “Cause–and–Effect Diagram”, “Ishikawa Diagram”, and “Fishbone Diagram” because the completed diagram resembles the skeleton of a fish.
Major use: To identify the root causes of a problem.
The only way to find the complete solution to a serious problem on the first attempt is to first explore ALL of the possible causes… not just the most obvious ones… or else your solution will only address part of the problem and the issue will reoccur.
The Fishbone diagram is a systematic way to determine the root causes of a problem.
Steps:
- Step 1 : State the problem or outcome/effect
- Step 2 : Identify the major categories of causes
- Step 3 : Brainstorm all of the possible causes for each category
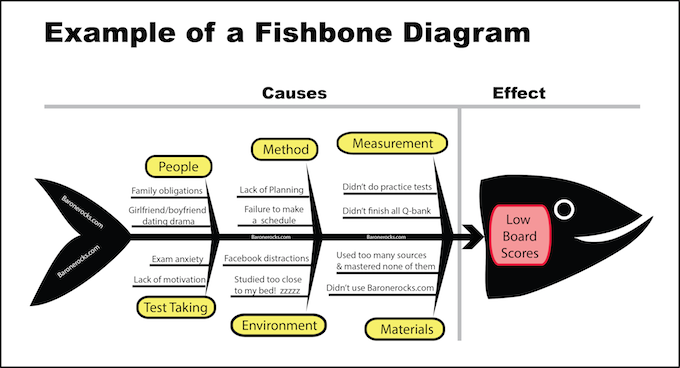
Here’s an example using something we know about all too well:
Copyright ©2015 Thunderpath Media Inc.
Add comment